Annual Potential Glare
Specular material that reflects Sun beam directed towards the view point is detected as a glare source and is marked in colour banding on the image.
Steps to create the Annual Potential Glare image and report
- Convert the model from Calculation dialog > Convert tab. For annual potential glare Convert to Radiance format and Convert to GPU format can remain unticked.
- Set the location in Settings > Project Settings > General tab by selecting the weather file.
- Assign specular material (ThinGlass, Mirror, Metal and Plastic) in Material dialogue to all surfaces that are considered to be potential for reflecting glare. All registered windows are automatically applied ThinGlass material and no separate material definition is needed in the material dialog.
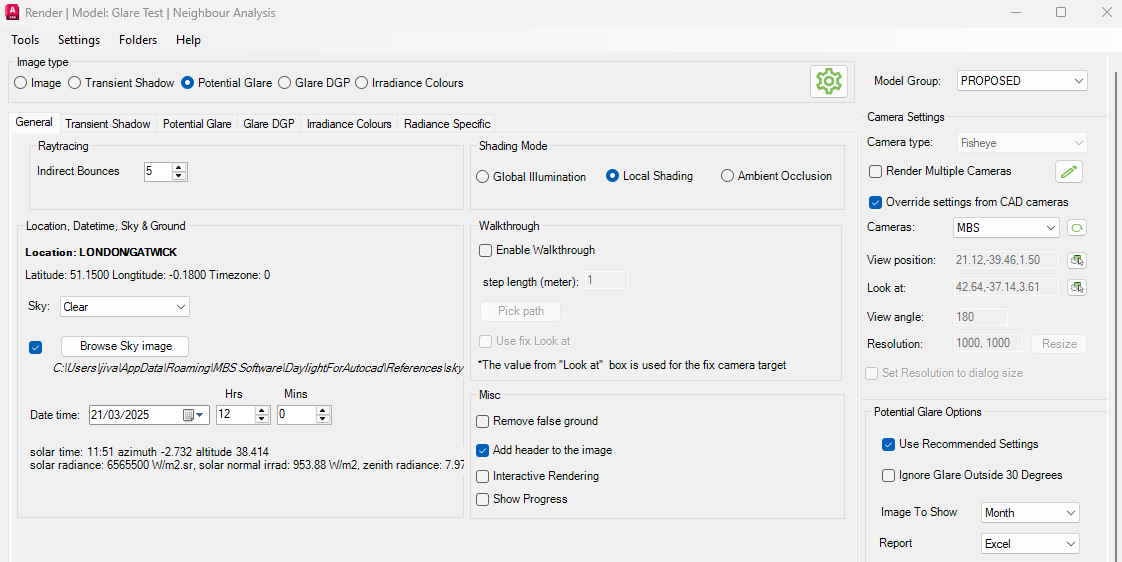
- Open the Render CPU dialogue. Select the view point and direction either by selecting a camera created in CAD software or by picking the coordinates from the model by pressing the button next to the input boxes.
- Select Potential Glare option
- Change options if necessary
- The Use Recommended Settings option should be ticked to use recommended view angle of 180 degrees, resolution of 1000 x 1000 pixels and a Fish eye camera type. Untick the option to specify custom values.
- The Ignore Glare Outside 30 degrees option can be ticked to ignore glare outside the 30 degree field of view.
- Image To Show can be set Month, Hour or LVeil. The chosen image will be shown in the Render dialog. All three images are always created and saved in the folder regardless of this option.
- Report combo box has options to create the report in Excel or CSV format. Set it to None to just create the render images.
- The report contains information for every pixel that has glare occurrence.
This includes date and time, glare duration, glare intensity in cd/m2, field of view angle of the glare and reflection angle - The report and render images are saved in the [Model_Name]_Waldram/GlareTest/Potential folder.
- GlareTest folder can be opened using Render CPU dialog menu bar > Folders > Glare Folder
- Additional options can be changed in the Render dialog > Settings icon > Potential Glare tab.
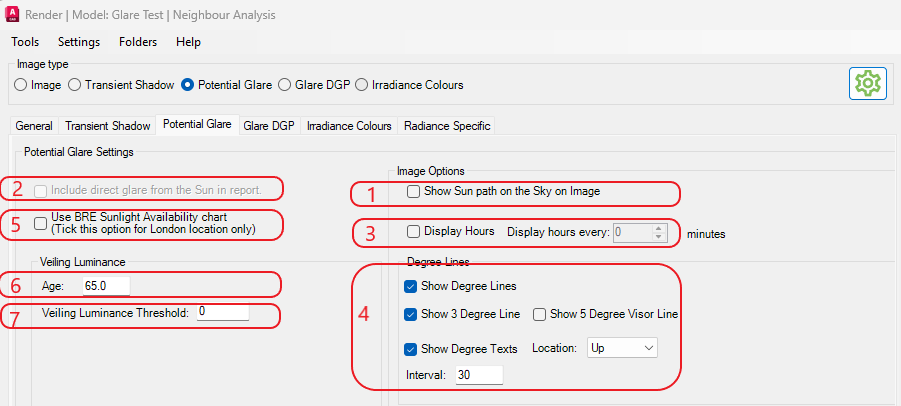
- Show Sun path on the Sky on Image option can be ticked to show the path of the sun visible from the view point.
- Include direct glare from the sun in report option can be ticked to show glare caused directly by the Sun.
- Display Hours option can be ticked to show the glare occurrence hour time on the month image. If the Display hour every is set to 0, then only the hour texts are shown e.g. 08:00 or 09:00.
If the Display hour every set to non zero value e.g. 15, then the hour and minute for the interval will be shown e.g. 08:15 or 08:30. This option can cause the image creation to take longer for smaller minute intervals. - Various options regarding degree lines can be set under Degree Lines section.
- Use BRE sunlight Availability chart option can be ticked to use BRE defined month weightage for cloud cover instead of using the values from the climate file. This can only be applied for London location. All other location will always use climate file data even when this option is ticked.
- Default observer age is set to be 65 to give the worst case result. Lower age can be used if necessary. This is used to calculate the K factor in the Stiles-Holladay Lveil formula.
- Veiling luminance threshold can be set to ignore glare occurrences where the Lveil is below the threshold.
Notes:
Options 1, 3 and 4 only affect the image. The potential glare result does not change due to these options.
Option 2 changes potential glare result but Show Sun path on the Sky on Image option must be ticked for this to be applicable.
Option 6 and 7 does not change potential glare result but will change veiling luminance result.
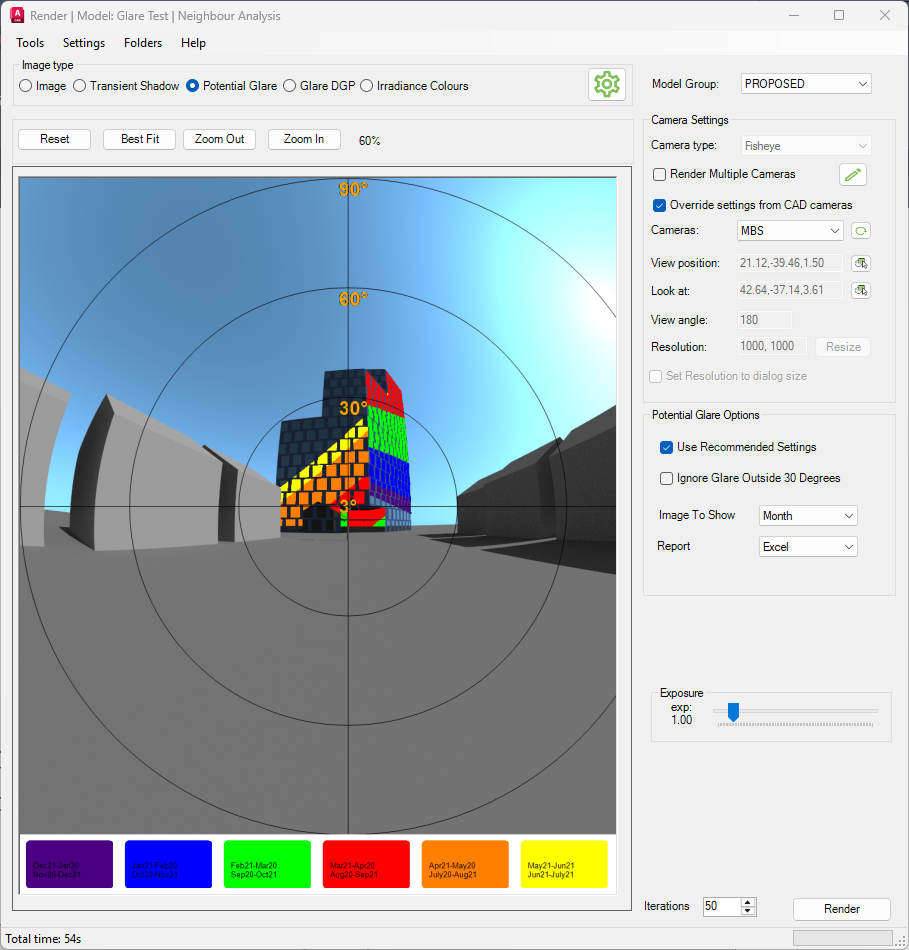
- Start the Iterations with at least 50 and Increase it by 25 to render a sharp image. The noise in the image is inversely proportional to the square root of this number. The image on the right is rendered with 50 Iterations and is little bit blurry so it should be rendered with higher subpixel samples.
- Press Render button.
- Some more options which are applicable to the render but do not affect the result
- Camera Settings section: Render Multiple Cameras option can be ticked to calculate potential render for more than one camera with a single click. The edit button next to the option can be used to select to render some cameras instead of all cameras in the model e.g. re-running only some cameras.
- Render dialog > Settings icon > General tab
- Shading mode: Local Shading (Faster) or Global Illumination (Slower as true reflection and softer shadows are created using raytracing around the scene). Ambient Occlusion is not suitable for potential glare calculation.
- Sky: Sky selection in the general tab is used when rendering the image. Potential glare calculation automatically uses Clear sky regardless of the sky selection here.
- Browse Sky Image: If the Tick box next to the button is ticked. The selected image will be projected on to the sky when the image is rendered.
- Add header to the image: Tick this option to add legend header to the Month, Hour and the Veiling luminance images.
Understanding the report
Potential Glare Report
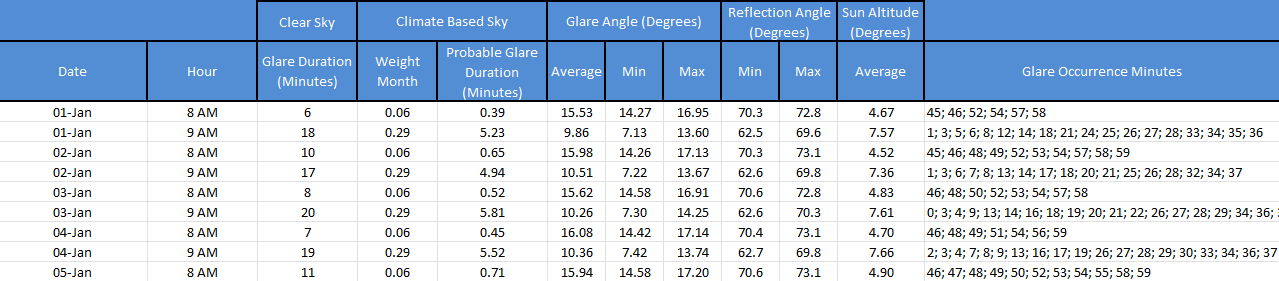
- Date and Hour columns show the glare occurrence date time
- Clear Sky Glare Duration column shows the total glare occurrence minutes in the date and hour where glare occurs.
- Climate Based Sky Weight Month column shows the probability of the sky being clear in the given date and hour.
- Climate Based Sky Probable Glare Duration is the multiple of the Glare duration and the weight month
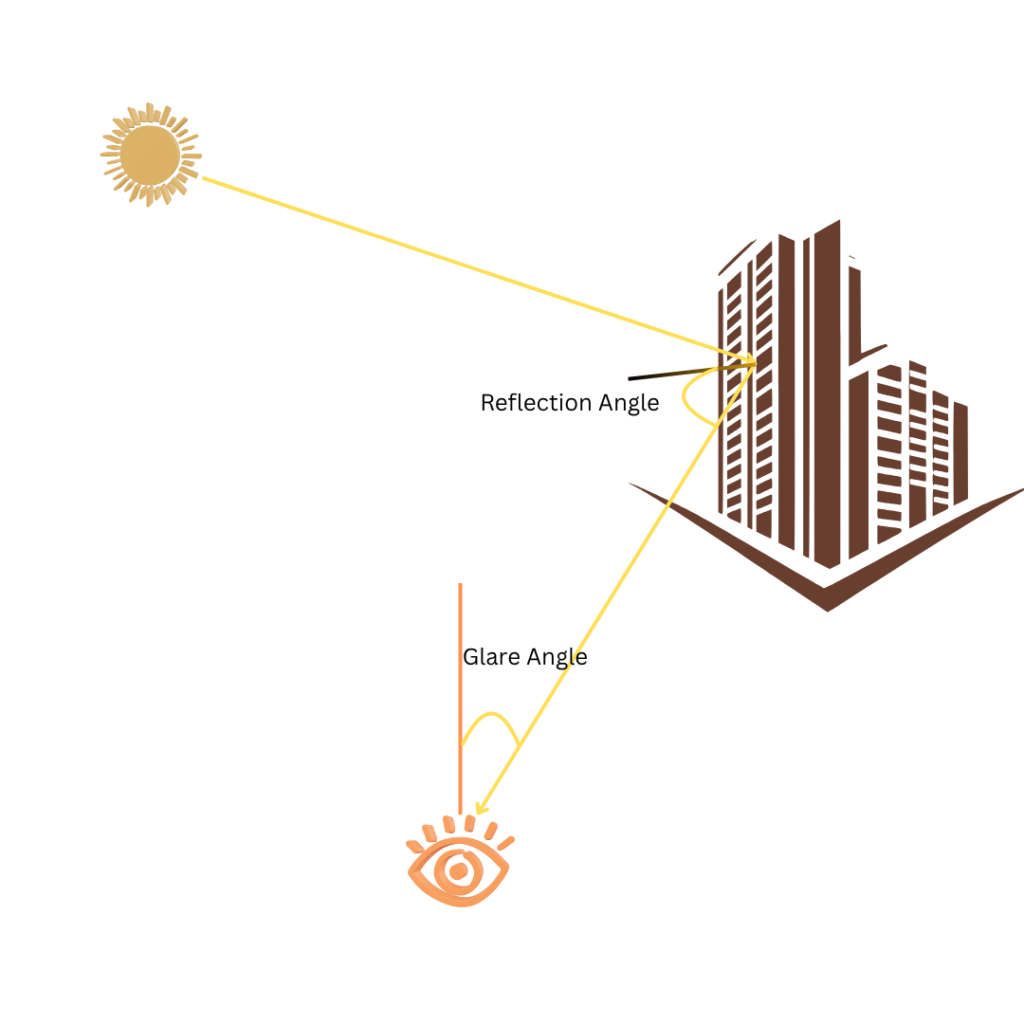
- Glare angle columns show the angle between the observer point/direction and the reflective surface (such as window glass, pv panel) or the Sun
- Reflection angle columns show the angle of reflection between the glare source and the reflected ray.
- Sun Altitude column shows the Sun’s elevation for the given date time.
- Glare Occurrence Minutes column shows the individual minutes in the hour when the glare occurs.
Notes
- Alternative Date and Hour data rows are shown after an empty row.
- Extra rows of data are added for the glare occurring directly from the sun when the rendering is done with the Include direct glare from the sun in report. These rows will typically have 0 values in Reflection angle Min and Max columns
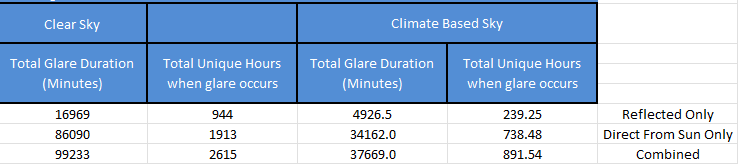
Potential Glare Summary
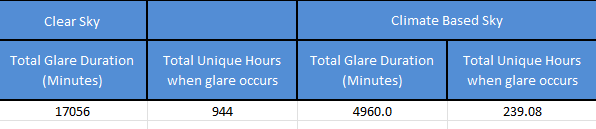
- Clear Sky Total Glare Duration is the sum of all the minutes when the glare occurs including the glare occurrence in the alternative date time.
- Clear Sky Total Unique Hours is the sum of all the unique hours when the glare occurs.
- Climate Based Sky Total Glare Duration is the sum of all the Probable glare duration minutes (after the climate based sky month weightage is applied)
- Climate Based Sky Total Unique Hours is the sum of all the climate based sky month weightage for each hour.
- The summary shows extra rows of data for the direct only glare and a direct plus reflected combined glare when the rendering is done with the Include direct glare from the sun in report
Veiling Luminance Report
- Veiling Luminance columns are added to the columns used in the probable glare report. These columns show the LVeil values calculated using the Stiles-Holladay formula
- The data rows will be the same as the potential glare report except when veiling luminance threshold is defined. In that case, potential glare report will show all occurrences of glare and the veiling luminance report will only show the glare occurrences where the LVeil value meets or exceeds the threshold.
Understanding the image output
- Circles
- The circles in the image represent degree steps defined in the potential glare settings tab except the first and sometimes the last step. If the 3 degree line is shown, it will be of red colour.
- The image on the right side top is created using a view angle of 180 degrees. The inner most red circle is a special one added to represent the 3 degrees of view angle (6 degree in total which is affected the most). The next three lines are for 30, 60 and 90 on each side and thus totalling the 180.
- If the view angle is not a multiple of 20, then the last one will be the half of the view angle. e.g. if the view angle of 70 is used with a 10 degree interval, then the circle lines will be for 3, 10, 20, 30 and 35.
- Colours
- Three images are created with the colours in the glazed surfaces represent the colours for the month, hour or the veiling luminance when the potential glare occurs.
- The colours of the month, hour or the veiling luminance can be changed in Legend Settings > Band > Glare CIE and selecting the appropriate mode.
- A legend with the keys and the colours can be added to the rendered image by going to Render dialogue options > General tab and ticking Add header to the image option.
- Additional Hour-Month,Day legend images are created for the annual potential glare occurrence and annual veiling luminance using the same colours.

Glare DGP
For the assessment of daylight glare EN17037 please refer to the annual potential glare.
This is a point-in-time calculation. Radiance evalglare program is used to calculate DGP value.
According to En17037 glare is defined as:
“Condition of vision in which there is discomfort or a reduction in the ability to see details
or objects caused by an unsuitbale distribution or range of illuminance, or by extreme
contrasts.“
DGP is defined as:
“the probability that a person is disturbed instead of the glare magnitude as a glare
measure. This new probability function is called daylight glare probability, DGP“.
It is an approach to consider both illuminance at eye level and individual glare sources of high luminance to estimate the fraction of dissatisfied persons.
According to En17037:
“DGP can be applied to any daylight oriented indoor space which is mainly side-lit and where the expected tasks are comparable to office tasks.“
| Criterion | Daylight Glare Probability(DGP) |
| Glare is mostly not-perceived | DGP <= 0.35 |
| Glare is perceived but mostly not disturbing | 0.35 < DGP <= 0.40 |
| Glare is perceived and often disturbing | 0.4 < DGP <= 0.45 |
| Glare is perceived and mostly intolerable | DGP >= 0.45 |
Steps to render an image for Glare DGP calculation
- Convert the model from Calculation dialog > Convert tab. For glare dgp calculation, Convert to Radiance format must be Ticked But Convert to GPU format can remain unticked.
- Set the climate file location in Settings > Project Settings > General tab
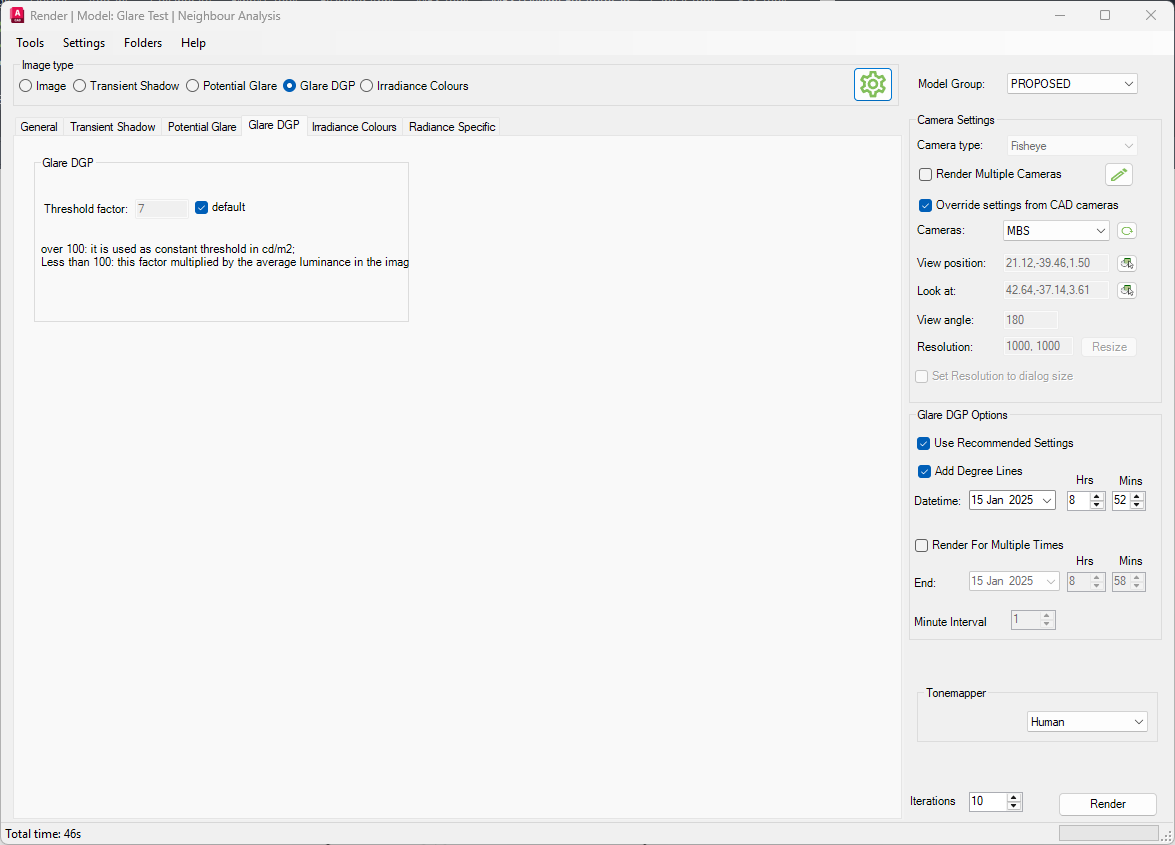
- The default Glare DGP threshold is 7 and it can be changed in CPU Render dialog > Settings > Glare DGP tab.
-
Based on the provided threshold either of the two methods are used for detection of glare sources:
-
Method A: Calculate the average luminance of the entire picture and count every section as a glare source that is x-times higher than the average luminance. For this method try values less than 100: this factor multiplied by the average luminance in the entire picture will be used as threshold for detecting glare sources.
-
Method B. Take a fixed value and count every section as a glare source that is higher than the fixed value. For this method try values over 100: the value is used as
-
- Render image is created for a single date time from the selected view point and direction.
- The View point, view direction can be specified by using a camera or by manually specifying the view point and look at positions.
- The Use Recommended Settings option should be ticked to use recommended view angle of 180 degrees, resolution of 1000 x 1000 pixels and a Fish eye camera type. Untick the option to specify custom values.
- Degree lines and text can be added to the image by ticking the Add Degree Lines option.
- Multiple images can be rendered in a click for a range of date time by ticking the Render For Multiple Times option and specifying the minute interval and the end date time.
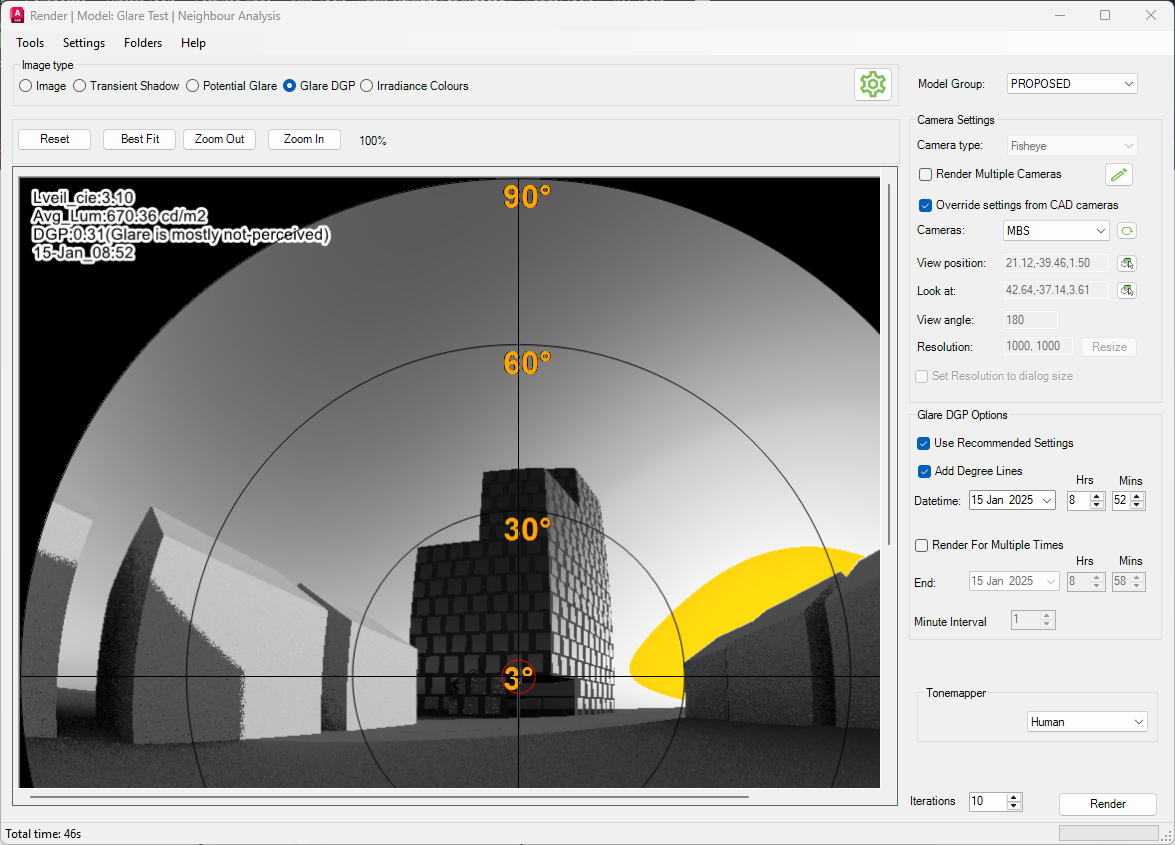
- Set the desired image quality (Iterations) and press Render. The yellow areas on the image displays the glare sources.
-
DGP value, Lveil_cie along with other glare metrics are calculated and saved in a text file in the [Model_Name]_Waldram/GlareTest/DGP folder.
- When the Render For Multiple Times option is ticked, the results go to [Model_Name]_Waldram/GlareTest/DGP_StartDateTime_EndDateTime folder
- e.g. DGP_15Jan_0852_15Jan_0858
- A new csv report is also created which lists the Datetime and Lveil_Cie results